Mobile Debugging Become Easy
Mobile devices are now the computing platform of choice for many business, user and consumers.
In Naukri most of the applications are on mobile, frequent updates are required on them. During debugging we were facing many problems which were also very time consuming.
Debugging Javascript on a mobile device can be maddening. I usually had no idea what went wrong, and I often got frustrated with a blank white screen and no clues. I could learn to use the debug tools available on each platform, but that would become onerous quickly.
I was aware of debuggers like Firebug and Webkit-based browsers which explores the code running in the co-located browser. But WEINRE does it remotely. And since it can work with any webkit browser, like those in Android and iOS mobile devices, it is a perfect match for mobile debugging.
Problems we were facing earlier:
- We used ADB chrome tool for android phone debugging using chrome, for that we had to change many developer settings of the mobile and it also had limitations for different versions of android.
- We were doing hit & try in many cases, which was also very time consuming.
- When there was some problem in particular mobile device, in most of the cases, we didn’t know what to do.
WEINRE consists of three pieces…
The first piece is a server called the “Debug Server”. It is the core component, and runs on a desktop machine or laptop, and communicates with the other two pieces.
The second piece is the “Debug Client”. This is a traditional webkit browser running on the same or different machine as the server. It connects to the server and presents the user with a familiar debugger view (like Web Inspector), where you can see what is going on and change the DOM.
The third and final piece is the “Debug Target”, which is the webkit-browser-under-test. It consists of a javascript library which runs in your mobile browser along with your application. It communicates with the server via XHR. With a little linkage to your code, this library exposes your javascript to the server for inspection and modification.
Process to debug with Weinre:
- Server files should be accessible from your mobile.
- You can get your current ip-address by running command ipconfig in your command prompt.
- To install weinre globally run – npm -g install weinre in your command prompt.
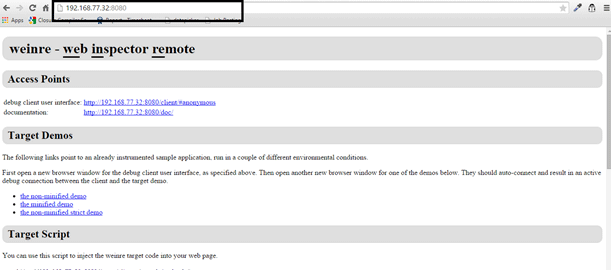
To check whether the weinre has been installed or not, you can run your ip-address with port number in the browser and it will show the weinre page as in the image below:
- Add this script file in your html file you want to debug. http://192.168.77.68:8080/target/target-script-min.js#anonymous
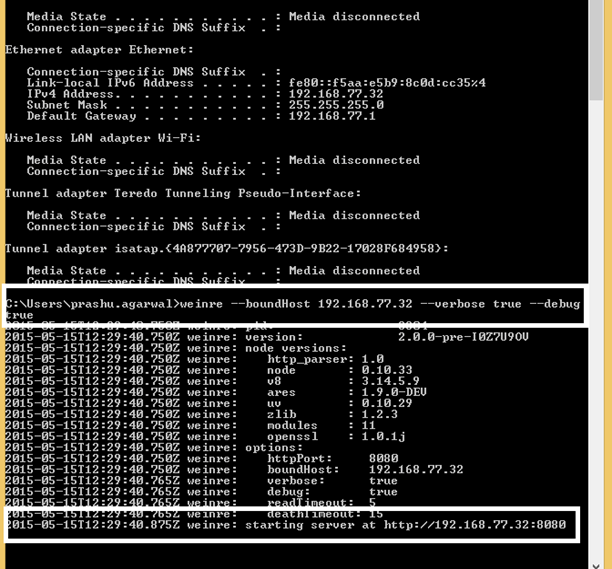
- Run weinre –boundHost 192.168.77.68 –verbose true –debug true command at your development machine.
After successfully executing this command Weinre server will be running on your particular ip-address.
- Open the link in the browser – http://192.168.77.32:8080/client/#anonymous
Aside: One WEINRE debug server can support multiple clients and targets. As a single client, I used “anonymous”.
The Debug Client on your Chrome browser listed the phone as a new Debug Target. Green means good contact. Under the covers, this means the phone had fetched the WEINRE javascript from the server, executed it, and made good XHR contact back to the server.
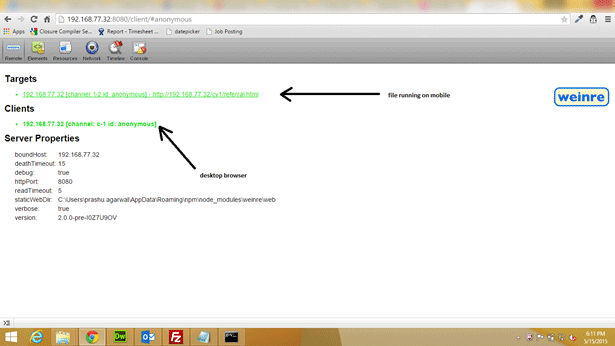
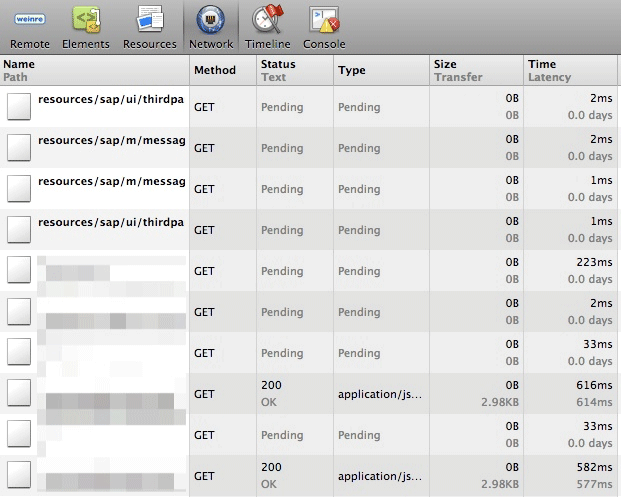
It has views for elements, resources, and the console, which let you view and modify the DOM, see console.log messages and much more. Console section will give you the ability to log the diagnostic information which will help to debug your web page or application and enter command that interact with the document.
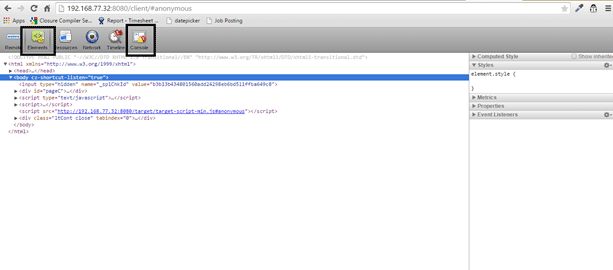
Note: This link is hard-coded directly to the explicit IP address and port of my Debug Server. Yours should link to your Debug Server.
Benefits with Weinre:
- Minimal set up time to start debugging for any web page.
I just need few minutes for all the setup to start debugging with weinre for every mobile and that is also for once.
- Can debug any mobile irrespective of OS or version or model.
There is no restriction regarding OS, OS version, and mobile model, you can debug any mobile using weinre.
- Time taken in debugging mobile is decreased a lot.
As I don’t have to install different tools for different mobiles or OS and we can debug the mobile as we are doing for the desktop.
- No settings need to be done from mobile.
To connect mobile to the desktop for debugging I need to do some settings changed in the developers settings for different debugging tools as ADB chrome but with weinre we don’t have to change any type of developer’s settings.
- Debug for multiple devices at the same time.
I can debug one file or multiple files, on one device or more at the same time, with no more extra developer’s settings need to be changed.
- WEINRE also works when testing hybrid apps in an Android simulator.


 The All-New Naukri iOS App (6.0)