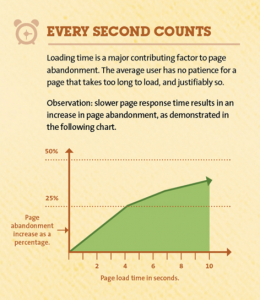
In web development, page load time is the key to make your users happy. According to an analysis on page load time by Kissmetrics, it has been found that page load time directly affects the abandonment of your page. This well explains how critical it is to maintain a low page load time.

Recently, we observed that one of the pages in the Recruiter’s site was taking a lot of time to load, which indeed was a matter of concern, considering that the page had a large amount of data to be shown on it.
While solving this problem, we realized that it’s not as difficult to do so, as one might think. By implementing a few simple steps, we ended up reducing the load time of our page by 0.5 seconds and would like to share the solution with you.
To begin with, we analysed the page for DOM and JavaScript rendering.
Tools used for analysis:
- DOM Monster
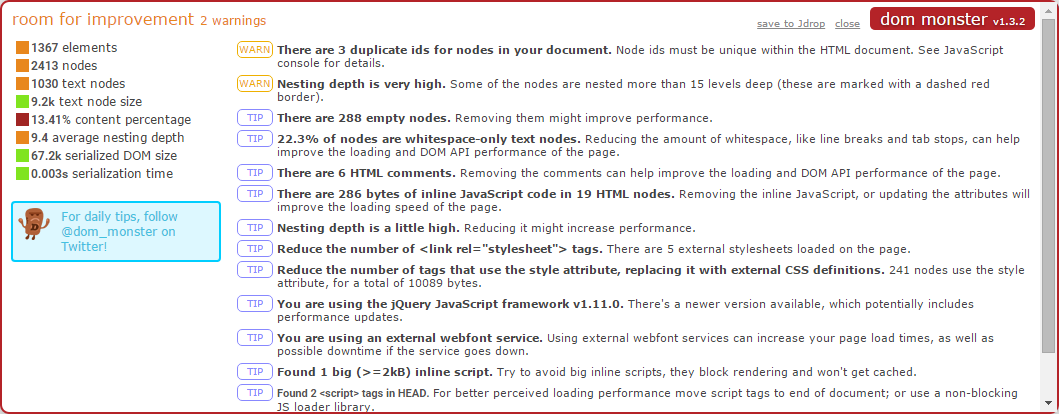
It is a cross-platform, cross-browser Chrome extension that will analyse the DOM of your page and give a performance report.
This report will include details like duplicate IDs, excessive stylesheets, excessive nesting, empty nodes, HTML comments, etc.
The report looks like this,

- Google Chrome Developer Tool for Profiling.
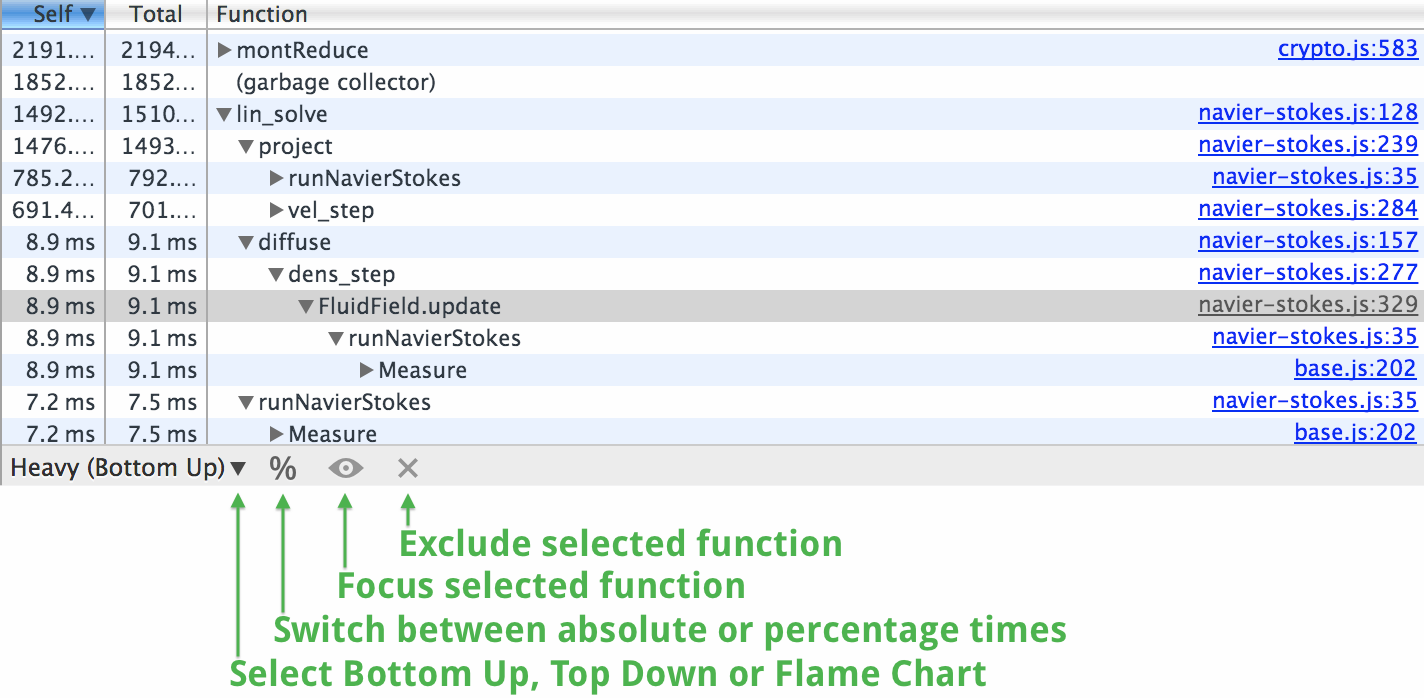
It provides us details on how long a piece of code took to run. The generated profiler show us performance of the functions, thereby helping us to analyze the JavaScript code written by us.
An example of the generated profiler is shown below,

Once our entire page was reviewed for HTML, CSS and JavaScript, we found a few issues and resolved them to reduce the load time of our page.
HTML & CSS Analysis to reduce the load time:
- Reduce the HTML content of your page.
- Ensure that your page has no HTML comments, as they add to the load time of the page.
- Empty nodes should be avoided on the page.
- It’s a best practice not to use more than three classes on any DOM element for styling. If needed, club multiple CSS classes into one to style your page.
- Ensure that your page has minimum DOM nesting of elements. Accessing the DOM in browsers in an expensive affair.
- Meta information, like the title attributes, can be added through JavaScript after window load, wherever possible, as this will help reducing the DOM content.
- We often use empty nodes for Icons, instead we should use optimized CSS to show such icons.
Example: To add ‘email icon’ along with a text, just use the class on the element with text and use background properties in CSS
Old Way:

Optimised Way:

CSS :
.mailIcon {
background : url(‘your_icon_file_url’) no-repeat 0 -216px;
// mention according to your icon position
padding-left : 20px;
}
- Use Unicode in your code wherever possible, instead of sprite.
For instance, to use arrow icon on your page, use unicode

→
- The number of external stylesheets and JavaScript need to be less to eliminate extra HTTP requests.
- Use Font Icons.
These are just fonts. However, instead of containing alphabets or numbers, they contain symbols or icons. We can style them with CSS in the same way as we style text. Just like image sprites multiple font icons can be kept in a single font-icon file. A font file is vector based, so it’s entirely scalable. Read more about Font Icons here.
- Use parallel loading.
Parallel Loading means serving different assets from different domains. This ensures faster downloading of your files, hence improving the page load time.
We use domain sharding for this. Domain Sharding is a technique which we split resources across multiple domains, improving page load time and search engine visibility.
- Use Lazy Loading for Images
It ensures that all the images on your web pages are not loaded as once. The images outside the viewport are not loaded until the user scrolls to that point.
JavaScript Analysis to reduce the load time:
Once you are done with the JavaScript coding for your page, ensure that you run the profiler to find the performance of your code.
Once a profiler is analyzed, you can optimize your code, if it takes longer time to run.
Also, you may call the functions and other DOM related code after window load, as it executes once the DOM content is loaded completely.
Use HTML5 Link Prefectching. It is a browser mechanism which utilizes browser idle time to prefetch documents that the user might visit in the near future.
Remember, don’t test the patience of your users, else, they will bid goodbye to you!
So keep Optimizing.
References:
http://mir.aculo.us/dom-monster/
https://developer.chrome.com/devtools/docs/cpu-profiling
https://blog.kissmetrics.com/loading-time/


 The All-New Naukri iOS App (6.0)