

Understanding Linux CPU Load – when one should be worried?
All must be familiar with Linux load averages. Load averages are the three numbers shown with the uptime and top commands – it looks like this:
load average: 0.09, 0.05, 0.01
Most administrators have a notion of what the load averages mean are the three numbers represent averages over progressively longer periods of time (one, five, and fifteen-minute averages), and that lower numbers are better.
Higher numbers represent a problem or an overloaded machine. But, what’s the threshold? What constitutes “good” and “bad” load average values? When should you be concerned over a load average value, and when should you scramble to fix it ASAP?
Understanding Load Average
What the load average values mean. I am using a simple example: a machine with one single-core processor.
A single-core CPU is like a single lane of traffic. Imagine you are a traffic signal operator … sometimes your lane is so busy there are cars lined up to cross. You want to let folks know how traffic is moving on your lanes. A decent metric would be how many cars are waiting at a particular time.
How about:
- 00 means there is no traffic on the lane at all. In fact, between 0.00 and 1.00 means, there is no backup, and an arriving car will just go right on.
- 00 means the bridge is exactly at capacity. All is still good, but if traffic gets a little heavier, things are going to slow down.
- Over 1.00 means there is pileup.
This is what CPU load is. “Cars” are processes using a slice of CPU time (“crossing the lane”) or queued up to use the CPU. UNIX refers to this as the run-queue length: the sum of the number of processes that are currently running plus the number that are waiting (queued) to run.
Therefore, your CPU load should ideally stay below 1.00. Also, like the traffic signal operator, you will be still ok if you get some temporary spikes above 1.00 … but when you are consistently above 1.00, then you need to worry.
So am I saying the ideal load is 1.00?
Well, not exactly. The problem with a load of 1.00 is that you have no headroom. In practice, many administrators will draw a line at 0.70:
- The “Need to Look into it”Rule of Thumb: 70 if your load average is staying above > 0.70, it is time to investigate before things get worse.
- The “Fix this now”Rule of Thumb: 00. If your load average stays above 1.00, find the problem and fix it now.
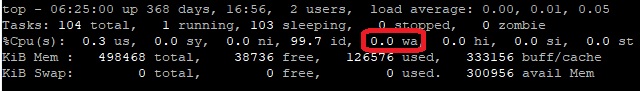
- The “Arrgh, its 3 AM WTF?”Rule of Thumb: 0. If your load average is above 5.00, you could be in serious trouble until you face CPU wait. Till CPU wait is 0, you should be fine.
What about Multi-processors? My load says 3.00, but things are running fine!
Let us have a quad-processor system and with it – is a load of 3.00 healthy?
On a multi-processor system, the load is relative to the number of processor cores available. The “100% utilization” mark is 1.00 on a single-core system, 2.00, on a dual-core, 4.00 on a quad-core, etc.
Multicore vs. multiprocessor
While we are on the topic, let us talk about multicore vs. multiprocessor. For performance purposes, is a machine with a single dual-core processor is equivalent to a machine with two processors with one core each? Yes. Roughly.
There are many tweaks here concerning the amount of cache, frequency of process hand-offs between processors, etc. Despite those finer points, for the purposes of sizing up the CPU load value, the total number of cores is what matters, regardless of how many physical processors those cores spread across.
Which leads us to two new Rules of Thumb:
- The “number of cores = max load” Rule of Thumb: on a multicore system, your load should not exceed the number of cores available.
- The “cores are cores“Rule of Thumb: How the cores are spread out over CPUs does not matter. Two quad-cores == four dual-cores == eight single-cores. It is all eight cores for these purposes.
Look at the load averages output from uptime:
~ $ uptime
23:05 up 14 days, 6:08, 7 users, load averages: 0.65 0.42 0.36
This is on a dual-core CPU, so we have lots of headroom. I will not even think about it until load gets and stays above 1.7 or so.
Now, what about those three numbers? 0.65 is the average over the last minute, 0.42 is the average over the last five minutes, and 0.36 is the average over the last 15 minutes. Which brings us to the question:
Which average should I be seeing? One, five, or 15 minutes?
Frankly, if your box spikes above 1.0 on the one-minute average, you are still fine. It is when the 15-minute average goes north of 1.0 and stays there that you need to snap to.
So # of cores is important to interpreting load averages … how do I know how many cores my system has?
cat /proc/cpuinfo to get info on each processor in your system. Note: not available on OSX, Google for alternatives. To get just a count, run it through grep and word count: grep ‘model name’ /proc/cpuinfo | wc -l
What will you prefer – More servers or the other hand, faster code?
Adding servers can be a Band-Aid for slow code. Take help of any standard APM to fix the bottlenecks in code


 The All-New Naukri iOS App (6.0)